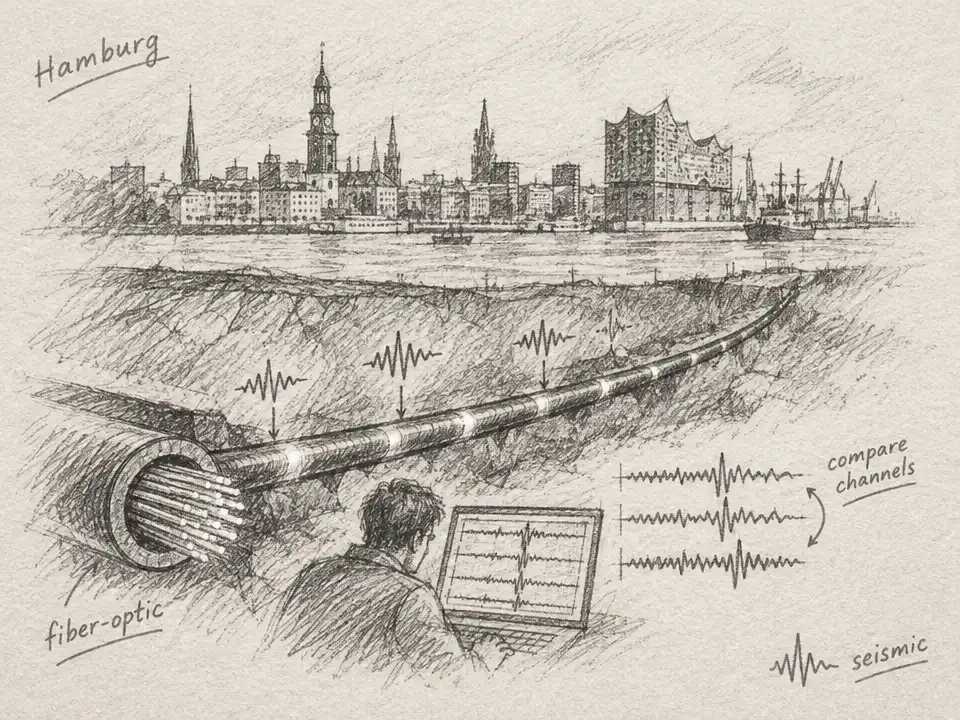
Imagine trying to map an earthquake with a sensor every meter—except the sensors are not metal boxes planted in the ground. They are points along a glass fiber, carrying pulses of light through tunnels, beneath streets, and past campus buildings. A research team in Hamburg has found a way to tell which stretches of this hidden network are listening clearly, which are drowning in local noise, and how their connection to the ground shifts with the seasons.
The fiber was built for telecommunications, not seismology. But when light travels through glass, tiny changes in the fiber’s length or refractive index alter the light that returns to the instrument. Vibrations can leave those changes behind. In distributed acoustic sensing, or DAS, an interrogator reads them along the cable, turning one continuous strand into thousands of virtual sensing channels.
That creates an unusual map: not a neat line of identical instruments, but a long chain of listening points with different surroundings. Some sections in the Hamburg network are buried; others run through tunnels, along cable trays, or near roads and mechanical equipment. Even neighboring points may not feel the same vibration equally. Protective coatings and the way the fiber contacts soil or other surfaces can weaken or distort the motion reaching the glass.
The challenge is deciding which channels deserve trust. A high reading might capture an earthquake—or a nearby disturbance, a poor connection to the ground, or some mix of all three. Conventional signal-to-noise measures can struggle when noise changes over time or differs sharply from place to place. And comparing every channel only with its immediate neighbors can mistake a local disturbance for the signal everyone should be following.
The researchers’ approach builds a local reference from the vibration patterns shared across a stretch of fiber. Then it measures how much each channel departs from that reference. The name, semblance distance, can sound like a measure of how far apart two sensors are. Here, it means something closer to the mismatch between their records: the larger the distance, the less a channel resembles the locally coherent pattern.
That comparison does not tell the team, by itself, why a channel differs. It does provide a practical way to flag sections where noise or weak mechanical coupling may be spoiling the measurement. The researchers checked whether those flags made sense against separate signal-to-noise and error measures, and against known differences in how the fiber was installed.
One test came from far beyond Hamburg. On February 6, 2023, the network recorded the magnitude 7.8 and magnitude 7.5 Turkish-Syrian earthquakes. At that time, the fiber measured 12.5 kilometers. The analysis picked out a relatively quiet stretch from about 1,110 to 8,000 meters, much of it buried roughly 20 meters underground. Sections closer to campus and exposed on cable trays showed more noise or poorer coupling. Short spikes inside the quieter stretch marked places where the installation changed.
A second test came from a much smaller event, deliberately made nearby. Researchers lifted a 1-tonne concrete cube about 5 meters with a forklift and dropped it. Though the resulting ground vibration was far weaker than either earthquake, the analysis again distinguished the central, quieter part of the fiber from noisier sections. That repeat pattern matters: the method identified similar strong and weak stretches under very different kinds of excitation, rather than relying on a single spectacular quake.
Then the team changed scale again, from seconds of vibration to months of gradual change. They analyzed recordings from February through May 2025, sampling the very low-frequency data once per minute. Across that period, the average semblance-distance values rose from approximately −63.6 dB in February to approximately −62.3 dB in May, with increases of roughly 0.3 to 0.5 dB per month. The underlying spatial pattern stayed recognizable, while the overall reading shifted.
The shift coincided with rising soil temperatures measured in Hamburg at 0.8 meters depth: monthly means went from 5.13 °C in February to 12.92 °C in May. The researchers suggest that seasonal warming could alter soil stiffness, moisture, cable tension, or contact between cable and ground, changing how vibrations reach the fiber. That is a plausible interpretation, not proof that temperature alone caused the change. The study tracked one network, and the channel-quality metric is an indirect view of the cable’s surroundings—not a thermometer or a direct measurement of ground contact.
Still, the comparison revealed something the team argues ordinary signal-to-noise and root-mean-square measures missed. The new metric reproduced the four-month temperature ranking exactly, while those two conventional measures did not. It also exposed small, recurring variations at particular positions along the route—possible fingerprints of installation features such as crossings, splices, or bends. Those explanations remain possibilities, but the fixed locations suggest the fiber’s physical route is written into its response.
That is the hidden promise of a cable that was already there: infrastructure can become a long, uneven scientific instrument, sensitive not only to passing seismic waves but also to the conditions that shape what it can detect. The work does not establish that every buried communications line can serve as a reliable earthquake array. It does show why the first task is learning how each section listens. Before a fiber can reveal what the ground is doing, researchers need to know which parts of the fiber are hearing the ground at all.