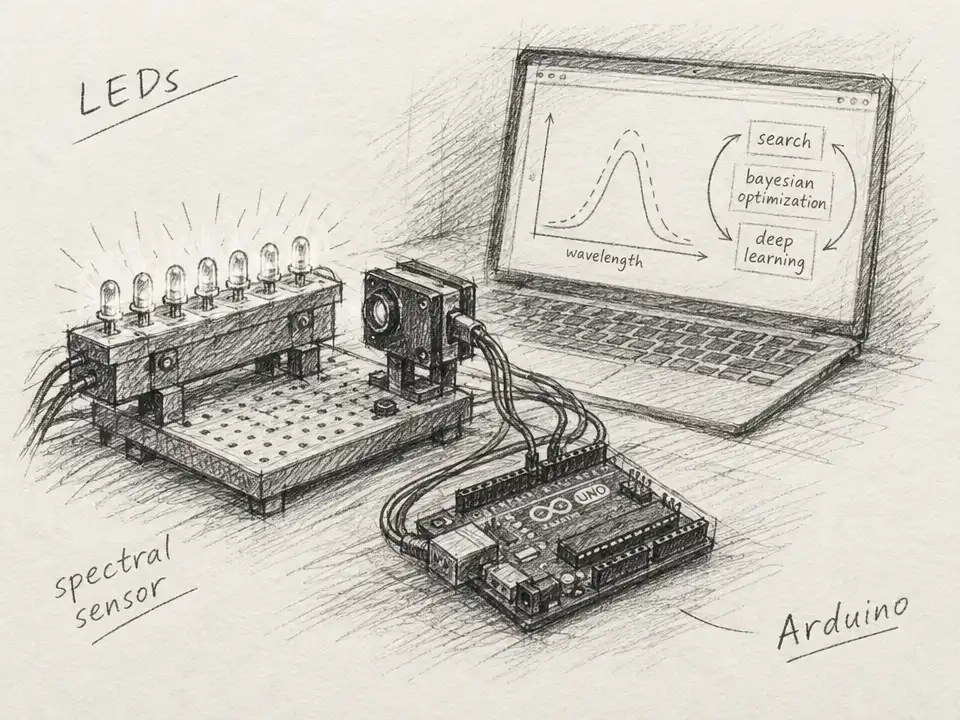
Imagine a laboratory as a room full of instruments, each waiting for a person to adjust a dial, take a reading, and decide what to try next. Now shrink that room until its central experiment fits on a tabletop: eight light-emitting diodes, a small sensor, a microcontroller, and a computer. In a recent demonstration, that modest setup did something associated with far more elaborate labs: it repeatedly measured its own output and used the measurements to choose what to do next.
The experiment was optical, but the deeper subject was a laboratory’s hidden machinery. A self-driving lab is not defined by its size or by a robot arm. Its essential feature is a loop: set a goal, change the experiment, measure the result, compare it with the goal, and use the mismatch to guide another change. The team’s open-source teaching platform makes that loop visible—and small enough for students to inspect.
The goal was to make the LEDs produce a chosen spectrum, meaning a particular pattern of light intensity across different color bands. Each LED had a different emission wavelength, and changing its voltage changed its output. A computer proposed voltage settings; an Arduino and an eight-channel digital-to-analog converter sent them to the lights. Above the LEDs, a multispectral sensor sampled the emitted light in separate channels. The computer compared those readings with the target and chose another set of voltages.
That sensor is important to the scale shift. It does not capture a continuous, finely detailed spectrum like a high-end spectrometer. Instead, its eight visible channels cover bands from approximately 415 nm to 680 nm, with additional clear and near-infrared channels. It offers a compact, affordable way to turn light into data—not a replacement for precision optical equipment. The platform’s purpose is to let learners watch an algorithm steer a physical system, rather than treat machine learning as mysterious software operating on a distant dataset.
The authors set three approaches to the same task. A traversal method searches through possible voltage settings in an orderly way, like testing branches of a decision tree. Bayesian optimization uses measurements to build a probabilistic model of how voltage settings affect the sensor, while keeping track of uncertainty. A deep-learning controller—a convolutional neural network—learns to predict useful voltages from the desired sensor pattern.
Each method reveals a different way of coping with uncertainty. In traversal, a coarse voltage step of 0.1 V can move quickly through the search but may miss a close match. A finer 0.05 V step improved the reported spectral agreement, at the cost of more searching. Bayesian optimization begins with sparse measurements and updates its model as it gathers more. In the paper’s illustrated run, its prediction and measured spectrum draw close after 400 iterations. The neural network takes another route: learn the mapping first, then make a prediction rather than rediscovering the answer through a long sequence of adjustments.
To train that network, the researchers measured individual LED responses and used them to create approximately 100,000 synthetic voltage–spectrum examples. In this construction, combinations of LED outputs were generated by summing the measured responses. The deeper of the two tested network configurations achieved a closer match to the target in the reported results. But that accuracy came with a tradeoff: deep learning needs training data and computing resources, while simpler search can be easier to deploy. The paper does not establish that one algorithm is best for every experiment; its point is that different methods make different compromises.
That distinction is part of what makes the apparatus useful as a teaching tool. Students can see that “AI” is not one magic decision-maker. A search procedure can be transparent but slow. A Bayesian model can expose uncertainty, not just give a guess. A neural network can learn a complicated relationship and respond quickly once trained, but its preparation takes work. Set the target spectrum, watch the physical lights change, and the abstract choices become observable: the sensor reports, the model updates, and the next action follows.
The authors describe the platform as costing approximately $60 and built from commercially available components, including an Arduino, LEDs, a sensor, and a computer-linked control system. Its low price does not erase its limits. The sensor’s resolution and dynamic range constrain measurement accuracy; LEDs can drift as they warm, and stray room light can affect readings. The researchers identify higher-resolution detectors, source calibration, and hybrid algorithms as possible improvements. Their demonstration is a compact educational platform, not an autonomous machine for discovering new materials.
Still, the perspective shift is striking. A high-profile “self-driving laboratory” can sound like a sealed, costly machine that conducts science out of human view. Here, the automation is exposed in a handful of components: one device makes light, another turns that light into a rough numerical portrait, and software uses the difference between result and goal to decide what happens next. The laboratory’s intelligence is not hidden in a robot’s body. It lives in the repeated exchange between measurement and action.
That is the small lesson with broad reach. Before a machine can explore a complicated scientific question, it must learn a humble skill: notice what happened, compare it with what was wanted, and adjust. On this tabletop, eight LEDs make that process tangible. The setup does not automate discovery—but it lets students see, step by step, how an experiment can begin to steer itself.