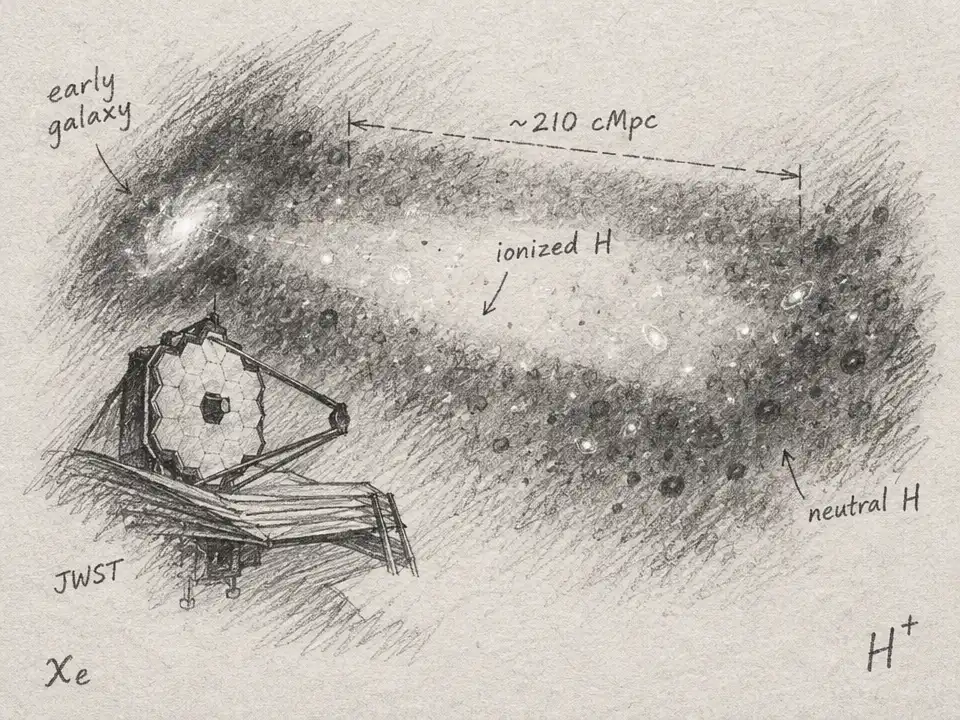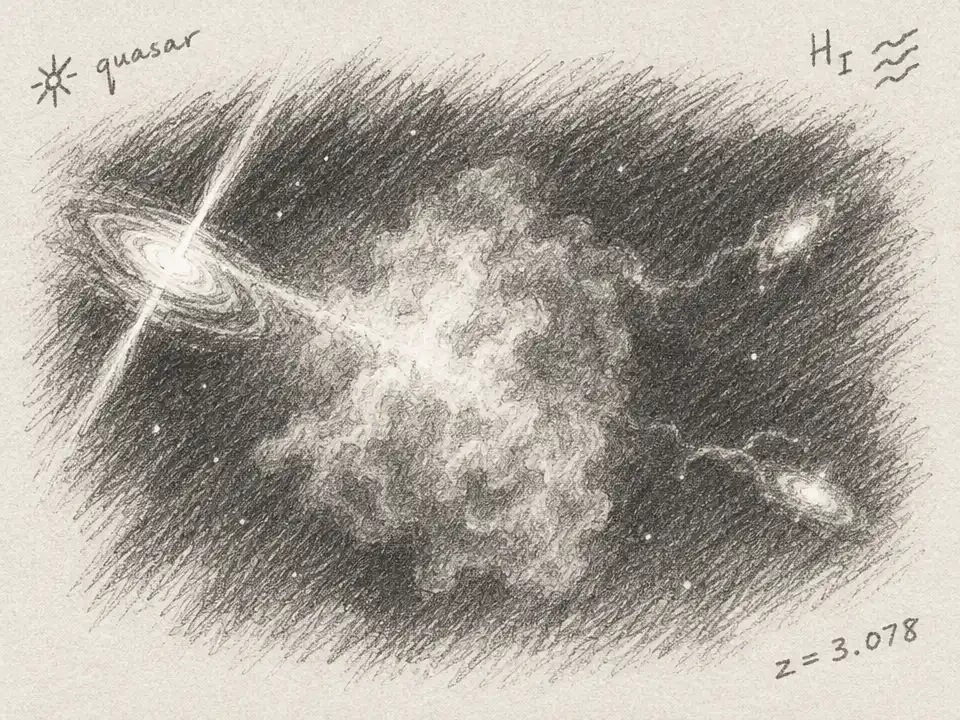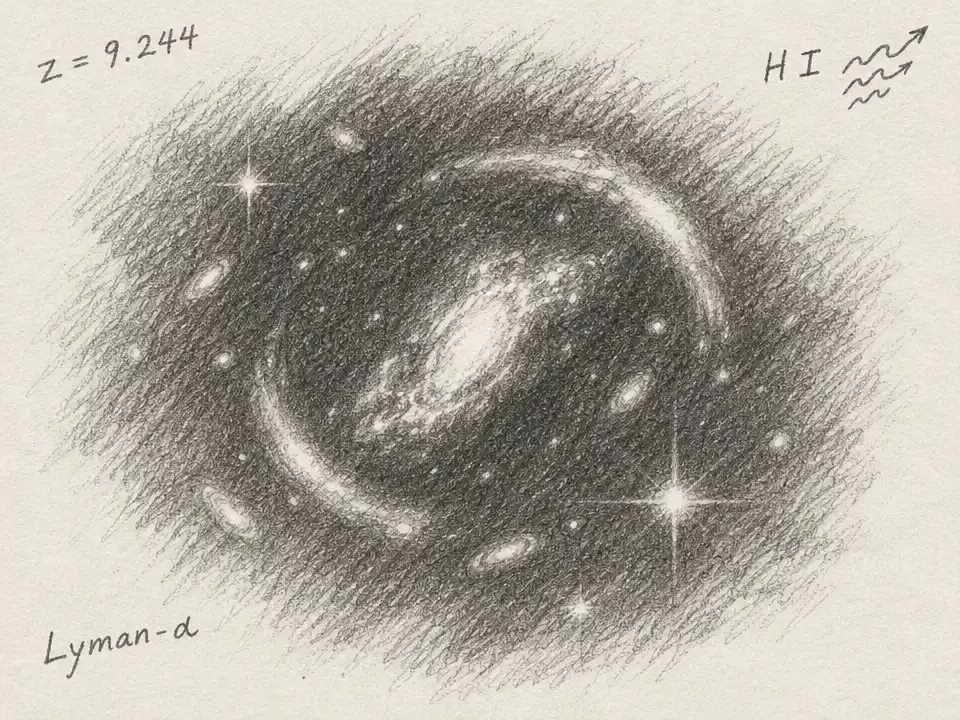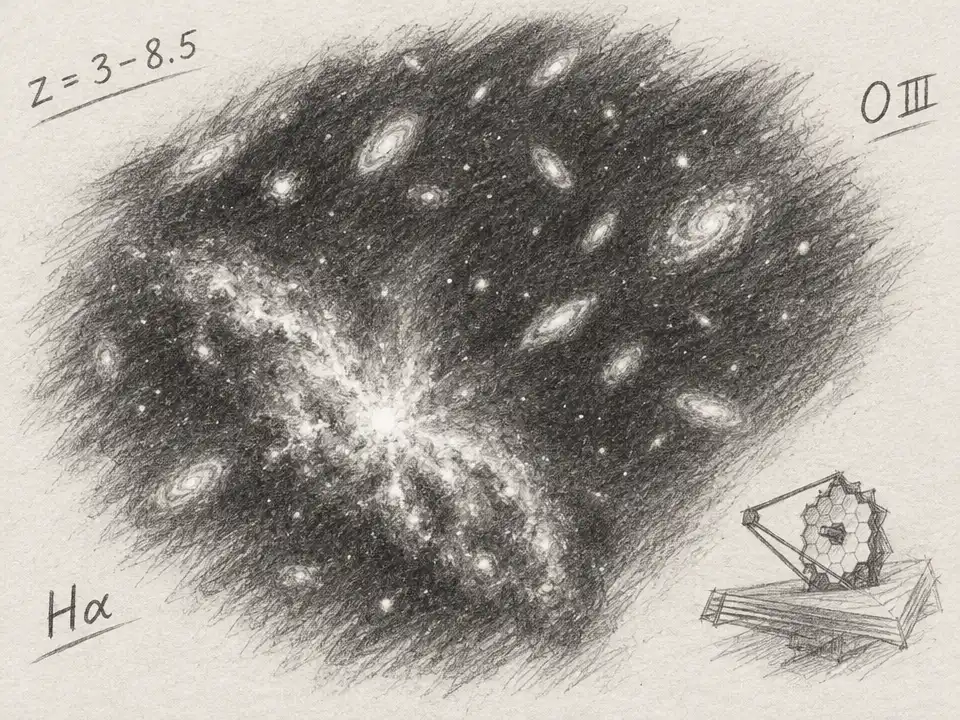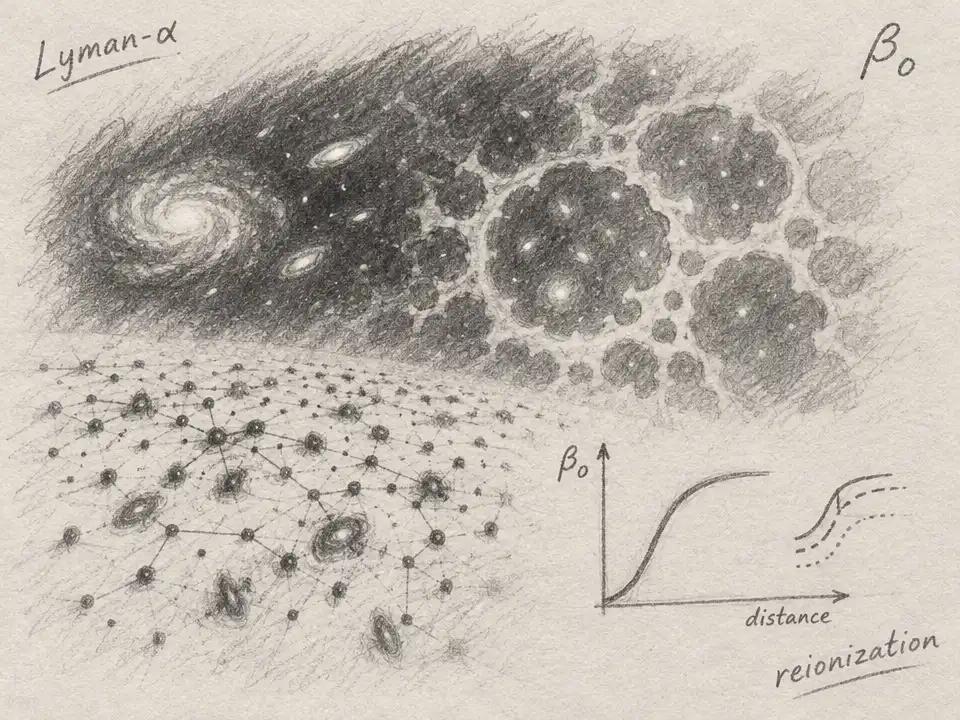
Sometimes the most revealing thing in a cosmic map is not what shines, but where the light goes missing. During the early universe’s reionization period, clouds of neutral hydrogen absorbed much of the Lyman-alpha light from young galaxies. A galaxy could shine brightly and still be hard to see unless it sat inside a bubble of ionized gas large enough for its light to escape.
That makes the galaxies we do see more than distant points of light. Their positions may preserve a record of the bubbles around them—and, indirectly, of how far reionization had progressed. But extracting that record is tricky. The pattern is lumpy, shaped by many overlapping bubbles, and ordinary ways of measuring galaxy clusters may miss some of its structure.
A study posted on arXiv in September 2026 brings in a tool from a seemingly distant field: topology, the mathematics of shapes and connections. The researchers asked whether a technique called persistent homology could help astronomers infer the state of the early universe from the way visible galaxies gather together.
Imagine plotting each galaxy as a dot on a map. Now let the dots reach toward one another: first nearby dots connect, then their groups merge as the allowed distance grows. Persistent homology keeps track of how many separate groups remain at each step. The resulting “Betti-0 curve” is a kind of changing census: it records how quickly isolated points become connected communities.
The idea is simple to picture, but useful because it follows the pattern across many scales rather than measuring it at just one chosen distance. If galaxies are more tightly clustered, their dots join up sooner. In the researchers’ simulations, a higher fraction of neutral hydrogen generally means smaller ionized bubbles and stronger clustering among the Lyman-alpha-emitting galaxies that remain visible. The curve’s shape can therefore carry clues about the bubbles’ influence.
Astronomers already have other ways to read such patterns. The angular correlation function counts how galaxy pairs are distributed across separations. The void probability function asks how often a randomly placed circle contains no galaxies. Each is a different summary of the same crowded—or empty—map. Persistent homology adds another view: instead of counting pairs or empty patches, it follows the merging of groups.
To compare the approaches, the team built simulated observations designed to resemble the SILVERRUSH survey, which has mapped Lyman-alpha emitters at redshifts 5.7 and 6.6. They used 21cmFASTv4 simulations for the evolving ionization field and assigned simulated galaxies Lyman-alpha properties using an empirical model. Then they accounted for the way neutral gas absorbs that light and selected mock galaxies in a way meant to resemble the survey.
This was a forecast exercise, not a new measurement of reionization from telescope data. The researchers generated many mock survey slices and used them to estimate how precisely each statistic might constrain the global neutral-hydrogen fraction, accounting for cosmic variance—the fact that different regions of the universe can have different patterns. In that comparison, the Betti-0 curve performed about as well as, or better than, the established statistics in the cases studied.
The strongest result came from letting the methods work together. At a neutral fraction of 0.05 and redshift 5.7, the combined statistics were forecast to reach an uncertainty of about 0.03. At a neutral fraction of 0.20 and redshift 6.6, the forecast uncertainty was about 0.07. The authors found that combining all three methods could improve constraints by a factor of about two compared with the angular correlation function alone.
Why should several ways of counting the same dots help? Because they are not actually counting the same information. The study found that the statistics draw most strongly on different physical scales: the angular correlation function emphasizes the smallest scales, while the Betti-0 curve and void probability function contribute differently across the map. Together, they cover more of the pattern than any one measure can. A cluster’s close-knit core, its wider neighborhood, and the gaps between groups become complementary clues.
The team also tested how contaminants—objects mistakenly included as distant galaxies—could affect the comparison. Adding them weakened the expected constraints for all the methods, but the Betti-0 curve kept a similar relative performance. A separate test varying the assumed luminosity threshold also found a modest, comparable effect across the statistics. These checks are encouraging, though they do not remove the need to test the method against real survey data and a fuller range of uncertainties.
That distinction matters. The forecasts rely on simulated universes, a model for how galaxies emit Lyman-alpha light, and assumptions used to turn the models into survey-like catalogs. Persistent homology has not yet revealed a new map of reionization by itself. What it offers is a new way to ask what information might be hiding in the arrangement of galaxies—and a way to combine that information with existing measurements.
Cosmic reionization left no simple photograph. Its history is written indirectly in which galaxies shine through the hydrogen between them and how those survivors cluster across the sky. By borrowing mathematics designed to follow connections, astronomers may be able to read that record more fully. In the vast scatter of ancient galaxies, the links between the dots could be part of the signal.