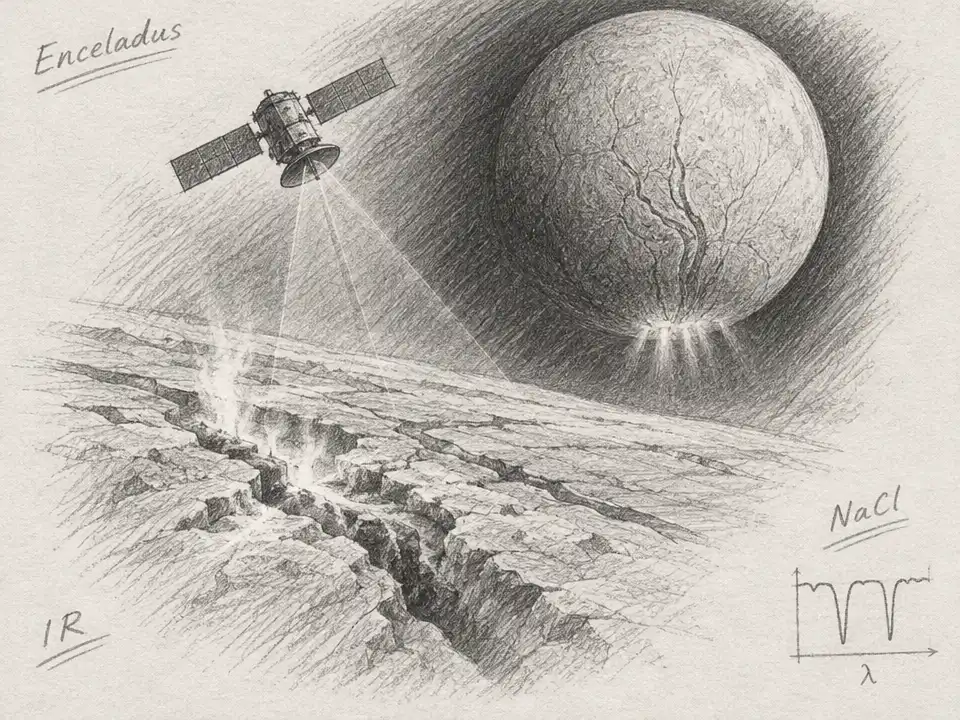
Imagine skimming 150 kilometers above Enceladus, Saturn’s small, ice-covered moon. Below, the ground changes from frigid darkness to warm fractures near the south pole, where jets of icy material escape into space. A camera making a map of this world would face an unusual challenge: the same instrument must detect the faint warmth of the coldest terrain and measure the brighter heat of the fractures. Researchers have now worked through a way to tailor its infrared filters to that task.
The proposed Enceladus Thermal Mapper is not yet a spacecraft instrument in orbit. The study is an initial design and feasibility exercise: researchers built a digital model to test how different filter combinations might serve different science goals. Their design draws on an existing multispectral instrument concept, adapted for a future mission that could orbit Enceladus. The mapper would use a 384-by-288-pixel sensor and, from 150 kilometers up, could aim for 80 meters per pixel across a 31-kilometer-wide track.
The key is that a filter does more than dim incoming light. It selects which wavelengths reach the detector. Enceladus’s cold ground emits little infrared energy, so the instrument needs broad, efficient filters that gather as much of that faint signal as possible. Warmer terrain calls for a different selection: its heat shines most strongly at shorter infrared wavelengths. Choosing filters, then, is like choosing windows in a camera—each one lets a different part of the scene through, while the limited sensor space forces researchers to decide which views matter most.
That tradeoff matters because Enceladus spans an extreme range. The study considers nighttime terrain as cold as 30 K and warm regions around the south-polar “tiger stripe” fractures, with some target conditions reaching about 200 K. Cassini provided important thermal observations, but its orbit around Saturn meant it made flybys rather than continuously circling Enceladus. Its global thermal maps had a spatial resolution of 25 kilometers, even though a close pass could briefly capture much finer detail. An orbiter equipped with a mapper could repeatedly survey the surface instead of collecting scattered close-ups.
Repeated maps could turn temperature into a record of what the ice is like. A patch that warms and cools quickly during the moon’s day behaves differently from one that holds heat. Those changes can help constrain the surface’s thermal inertia—the way its material stores and releases heat—and provide clues about properties such as density and conductivity. The time scales matter, too: daily changes probe the upper few centimeters, seasonal changes can reach roughly a meter down, and a brief eclipse as Enceladus passes through Saturn’s shadow affects only the top few millimeters.
Most strikingly, the researchers also tested whether infrared filters might help map salt on the surface. Sodium chloride has been detected in ice grains from Enceladus’s plumes, linking it to material from the moon’s subsurface ocean. The proposed method compares light measured through a filter aimed at a chemical feature with light through a nearby “continuum” filter. A difference between the two signals could indicate the feature, much as comparing two carefully chosen colors can make a faint detail stand out.
In their best-case calculation, the team designed two channels around a sodium chloride spectral feature and allocated half the sensor’s available pixels to them. For a surface assumed to be pure sodium chloride, their model found that a three-sigma detection would require a signal-to-noise ratio of 52, achievable at about 160 K. At 180 K, the simulated setup reached a signal-to-noise ratio of 161 in a single pass. Those numbers describe an idealized surface, not a prediction that salt will be detected across Enceladus. Colder areas could require combining observations from multiple passes, and adding composition filters would leave fewer pixels for temperature measurements.
That is why the paper compares several filter assemblies rather than declaring one universal winner. A low-temperature version favors long wavelengths and stronger signals from cold terrain, but gives up some ability to distinguish small warm spots. A high-temperature version is better matched to the tiger-stripe region, at the expense of the coldest surfaces. A salinity-focused version prioritizes chemical comparison. The proposed generalist arrangement tries to cover a wider range of conditions. In the model, its signal for the 30 K case falls from 2.6 to 2.1 compared with the specialized low-temperature setup; repeated passes could help recover sensitivity.
There are important steps between this model and a working camera at Saturn. The longest wavelengths may make the image resolution diffraction-limited, a question the study did not fully analyze. Heat from the spacecraft or the instrument itself could also interfere with readings of extremely cold terrain. Researchers still need to test how different forms of ice behave in the relevant conditions and calibrate the instrument for its intended environment. The filter design is a proposal for what to build and test, not a finished demonstration in space.
Still, the approach reframes what a small mapping instrument can do. Instead of asking one fixed set of filters to serve every scientific question equally, the design process weighs cold-terrain sensitivity, warm-fracture measurements, and possible surface chemistry against the same limited detector. If a future mission carries an orbiter like the one imagined here, its repeated thermal maps could help separate sunlight-driven warming from heat rising from within. That would sharpen questions about Enceladus’s geology and its ocean—not answer whether the moon is habitable, but show researchers where its heat and surface clues are most revealing.