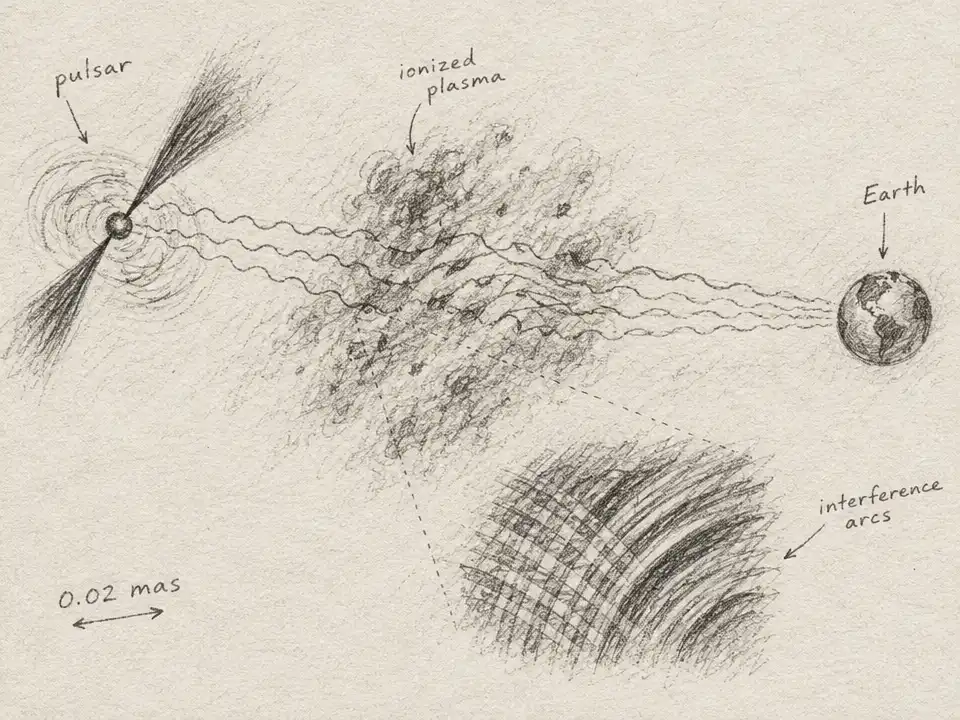
Imagine trying to study a distant lighthouse by watching its beam wobble—not because the lamp is changing, but because the air between you and it keeps bending the light. Astronomers have a radio version of that puzzle. A pulsar, a rapidly rotating neutron star, sends radio pulses across the Milky Way. On the way, the waves pass through thin, ionized gas. The gas is hard to see directly, but its uneven patches make the pulsar’s signal flicker and interfere with itself. In that disturbance, researchers have found a way to trace a hidden landscape.
The target was PSR B0355+54, about 1.0 kpc away. From 2020 to 2026, a team observed it 54 times with the Shanghai Tianma Radio Telescope, tuning in simultaneously at 2.25 and 8.60 GHz. They weren’t simply checking whether the pulsar looked brighter or dimmer. They examined how its signal varied across time and radio frequency, then transformed those variations into a kind of interference map called a secondary spectrum. In that map, different radio paths can draw curved arcs.
The arcs are not pictures of gas clouds. They are patterns made when radio waves that took slightly different routes arrive with different delays and apparent shifts in frequency. Their shape carries information about where the scattering material lies and how the scattered waves are distributed. It is a little like learning about a windstorm from the ripples it leaves on a pond: the surface is not the wind, but it records the wind’s effects.
At 2.25 GHz, the team found nearly the whole catalog of known arc appearances: forward arcs, inverted arclets, broad diffuse arcs, diffuse power, and irregular patterns. Some shapes changed over days or even hours. Arcs appeared in all 53 usable observations at that frequency. At 8.60 GHz, they appeared in 33 of 49 usable observations, and the spectra were usually simpler, dominated by faint forward arcs. The same pulsar seemed to show a busy, shifting pattern at one frequency and a much quieter one at another.
That contrast raised a natural question: were the two radio bands passing through different structures? The researchers compared the arcs’ scaled curvatures and how those curvatures changed over the year. The measurements were consistent with both frequencies tracing the same dominant scattering screen—a region of ionized material that bends the radio waves. In their joint fit, the screen’s fractional distance was s=0.069, with an uncertainty of +0.015 and -0.014. The corresponding estimated distance from Earth was 0.93 kpc, with an uncertainty of +0.19 and -0.09 kpc, placing it near the pulsar rather than halfway along the route.
The screen may be associated with the H II region Sh 2-205, a region of ionized gas. But “may” matters: the association is suggestive, not confirmed. Nor did the data settle every question about the screen’s geometry. Isotropic and anisotropic models gave nearly identical fits to the annual changes, with no clear preference between them. The arcs offer clues about a hidden structure, not a uniquely solved map.
Still, the arcs held a remarkably fine-grained clue. By reconstructing the distribution of radio brightness in the scattered image, the researchers found localized features on angular scales down to about 0.02 mas. At the screen’s distance, that corresponds to about 0.02 au. These are inferred features in the scattered radio image, not objects photographed in the gas itself. The reconstructions are approximate, and the data do not uniquely fix the full two-dimensional picture. Even so, the result points to structure on scales far smaller than the distance between the Sun and Earth.
A closer look at four arclets revealed motion written into the pattern. During a 10-hour observation at 8.60 GHz, the researchers tracked how the arclets shifted in the secondary spectrum. If the features belong to the same screen as the main arc, the pattern is consistent with the line of sight sweeping across it at about 61 km/s, or roughly 14 mas per year. At that rate, the line of sight could move by a distance comparable to the scattered image’s 0.3 mas extent in about eight days. That offers one explanation for why the radio pattern can change so quickly: Earth, the pulsar, and the intervening material keep changing their alignment.
The scale shift is the story’s quiet surprise. A pulsar nearly a kiloparsec away can act as a probe of structures in the thin material between stars, even when those structures are too small and faint to resolve directly. The probe works because the radio signal arrives carrying traces of its journey—delays, frequency shifts, and interference curves that can be compared across observing times and frequencies.
There are limits to what those traces reveal. More than one scattering screen may contribute, and intensity patterns alone cannot determine the complete shape of the scattered image. The possible link to Sh 2-205 remains uncertain. Broader, simultaneous observations could help distinguish how much of the changing pattern comes from frequency-dependent structure, multiple screens, or the moving line of sight. For now, PSR B0355+54 offers a reminder that the space between stars is not blank. At the right scale, a radio flicker can turn it into a landscape.