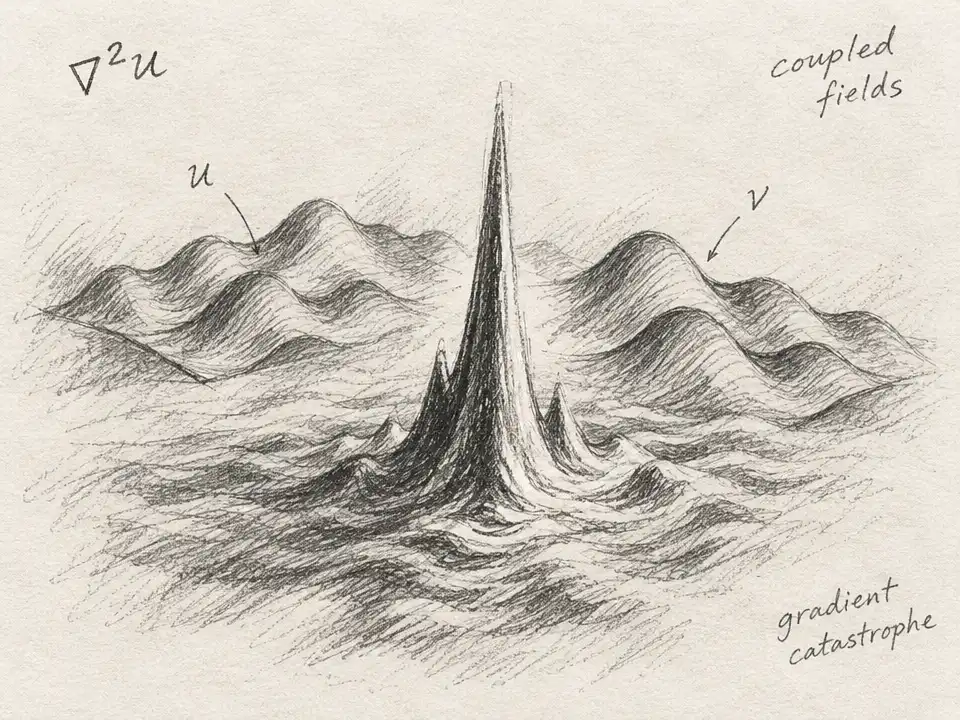
Here is a puzzle from a computer-generated ocean of turbulence: make the water more strongly stratified, and the fluid parcels’ energy fluctuations get smaller. Yet the losses become more lopsided. The flow, in one statistical sense, grows quieter; in another, its energy drops become more sharply one-sided. What hidden change could make both things true?
Stratification is the layering of water by density. In a stably stratified fluid, a parcel pushed up or down meets buoyancy that tends to pull it back toward its original level. That resistance suppresses vertical motion and rearranges the flow. It is common in the ocean’s interior, where turbulence helps transport heat, salt, and other tracers. But understanding the parcels’ individual journeys takes a different view from measuring the flow at fixed points.
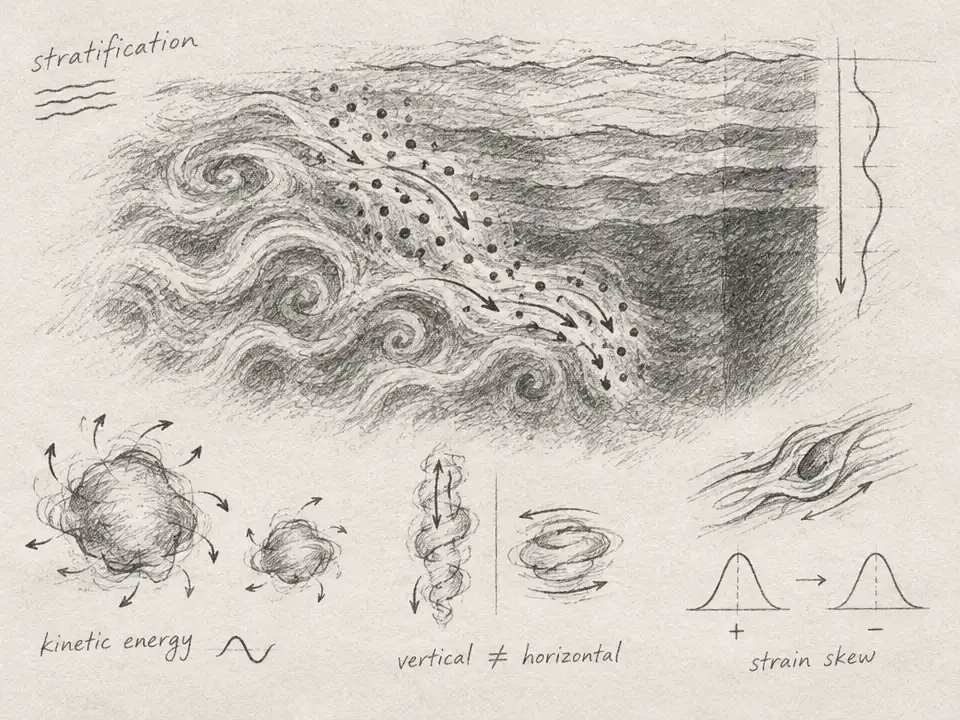
The researchers followed virtual tracers instead. In direct numerical simulations, more than a million tracers moved with a turbulent fluid governed by the Boussinesq approximation, a model that captures how density differences affect motion through buoyancy. Along each path, the team tracked the parcel’s kinetic energy and how quickly it changed. Energy rising counted as a gain; energy falling, a loss. The average change can hover near zero in a steady flow, while individual parcels still experience plenty of ups and downs.
The first clue was a contrast between the size and shape of those ups and downs. The simulations compared an unstratified reference with three stronger stratification settings. Between the reference and the strongest setting, the standard deviation of kinetic-energy change fell from 14.2229 to 7.59499, in the simulation’s units. But the distribution’s skewness shifted from −0.78652 to −2.32202. Negative skewness means the distribution has a more pronounced tail toward energy loss: comparatively gradual gains, interrupted by sharper drops. Turbulence’s familiar flight–crash pattern had become more pronounced even as the fluctuations weakened overall.
That result is not a claim that every parcel loses energy more often, or that the ocean as a whole is losing energy. It is a statement about the shape of a statistical distribution. To find out what might be behind that shape, the researchers divided the flow into local patterns based on how neighboring fluid was rotating or being stretched and compressed. Some regions were vortex-dominated; others were dominated by strain. A single global average, it turned out, blurred important differences.
One strain-dominated pattern offered a particularly striking clue. In this “biaxial” geometry, the local flow stretches along two directions and compresses along one. Its energy-change skewness was slightly positive in the unstratified reference, at 0.153. With stratification, it turned negative, reaching −2.290 in the strongest case. By contrast, the “axial strain” pattern—one stretching direction and two compressing directions—had the most negative skewness of the four patterns at every tested setting. The flow did not respond as a single machine; its local geometries had different statistical stories.
A second clue came from separating horizontal from vertical energy changes. As stratification strengthened, horizontal power became more negatively skewed, while vertical power moved in the opposite direction and became positively skewed at stronger settings. Add those components together and the overall trend hides the disagreement between them. The result fits a flow whose vertical motion is constrained, but it does not by itself explain why the full energy distribution acquires its stronger negative tail.
Could buoyancy be the answer? It does exchange kinetic energy with potential energy, and in the simulations its contribution was negative across much of the sampled kinetic-energy range, consistent with kinetic energy moving into potential energy. But the direct buoyancy contribution’s third-moment statistics were comparatively small beside those of the total kinetic power. This makes buoyancy an incomplete explanation for the changing asymmetry, not an irrelevant one.
Pressure supplied a more intriguing lead. In an incompressible fluid, pressure is not merely a local push from the nearest parcel: its spatial pattern reflects the surrounding flow. In the simulations, the pressure contribution’s skewness shifted from nearly symmetric, 0.00524, in the reference case to −1.56 at the strongest stratification. Conditioned on parcel speed, pressure tended to add power to slower parcels and subtract it across a broad range of faster ones. That looks like a restoring tendency in the averages—not a force that acts this way on every parcel, and not proof that pressure causes the overall skewness.
There is a catch. The skewness of the pressure contribution cannot simply be added up to account for the skewness of total power; interactions among the different contributions matter too. Nor did the study establish that stratification caused the pressure pattern through one particular route. A drift toward more two-dimensional flow might be involved, but the authors note that their weakest stratified case had not been influenced by buoyancy at every scale. Their simulations also used vortical forcing applied only to horizontal motion, which may shape the results. Testing other forcing patterns, including isotropic forcing, is a needed next step.
The tracers offered another possible piece of the puzzle: they did not spend equal amounts of time in every local flow pattern. Their residence-time distributions had exponential tails, and the fitted times changed with stratification. Tracers tended to leave three of the four patterns sooner as stratification increased, while their time in the fourth rose at the strongest setting. Unequal sampling might help shape the overall statistics, but the simulations did not establish a direct link between residence time and energy crashes.
So the puzzle remains open, but it is sharper now. In these simulations, stronger stratification accompanied smaller energy fluctuations and a more pronounced negative tail, while local geometry, direction of motion, pressure, and tracer residence all offered clues. The results describe a controlled numerical flow, not a direct measurement of ocean mixing; the simulated Reynolds numbers were also below typical ocean values. The next challenge is to find which clues connect—and whether the pattern holds in flows closer to the real sea.