Imagine asking a thermometer to predict tomorrow’s rain. The answer might depend on more than today’s temperature: the atmosphere and ocean have been storing the effects of earlier changes, and they do not all respond at the same pace. That makes climate clues tricky. Two measurements can move together over decades yet fail to predict each other from one year to the next. A new mathematical framework asks a more revealing question: can the past trajectory of one climate variable help reconstruct how another responds to the same warming push?
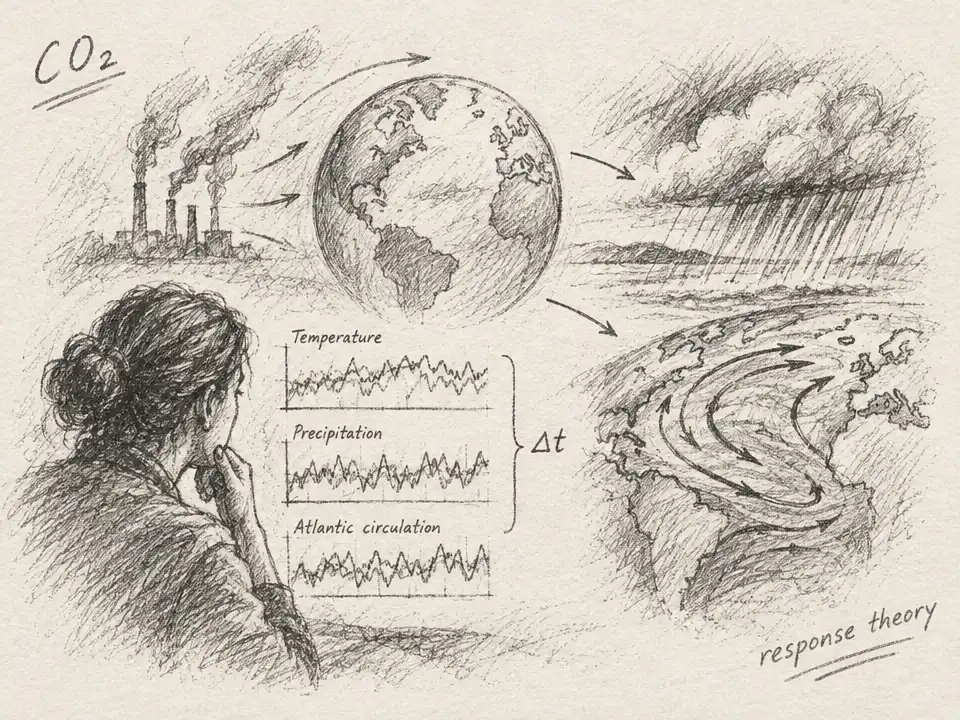
The tool comes from a field that may seem far from climate forecasting: response theory, developed in mathematical physics to describe how a system changes when it is disturbed. Give a system a push, and its response unfolds over time. The mathematical record of that unfolding—sometimes called a Green’s function—acts like a fingerprint of the system’s memory. It captures not only whether a quantity changes, but how long the effects of the disturbance take to appear and fade.
Climate scientists already use a related idea called an emergent constraint. A climate model may be uncertain about one outcome, such as future rainfall, while another, such as surface temperature, is easier to measure or better understood. If the two responses are reliably linked, the better-known quantity could help constrain the uncertain one. The familiar version looks for a direct relationship: when temperature changes by this much, how much does rainfall change? The new framework widens the lens. It allows the rainfall response to depend on the whole history of temperature change, not just the two values at a single moment.
That difference matters because the link can run one way but not the other. To test it, the researchers used the Max Planck Institute Earth System Model, a climate simulation, rather than observations of the real-world climate. They compared two experiments: one abruptly doubled atmospheric carbon dioxide from preindustrial levels; the other increased it by 1% per year until it had doubled, after about 70 years. Both experiments ended at the same carbon dioxide level, but the route there differed. The team used the first experiment to build mathematical response fingerprints, then tested whether those fingerprints could reconstruct what happened in the second.
At first, the obvious clues looked unreliable. Compare annual global surface temperature with annual global precipitation, and the relationship does not provide a dependable shortcut. The framework’s test showed why: at that fine time scale, the mathematical link between the two variables was not sufficiently causal in the technical sense needed for reconstruction. In some cases, a method that used one variable to predict the other produced a poor estimate—or even the wrong direction of change. A neat scatterplot, in other words, does not guarantee that one climate measurement can serve as a trustworthy guide to another.
Then the researchers changed the time scale. Instead of asking what happened in a single year, they averaged the signals over longer periods. With global surface temperature as the clue, the reconstructed response of total precipitation became nearly accurate at averaging periods of 10 years or more. Reversing the roles took longer: precipitation needed to be averaged over roughly 20-year periods before it became a good guide to temperature in the simulations. The same pair of variables, observed at different time scales, gave different answers about whether a useful relationship existed—and in which direction.
There is a physical reason not to expect all rainfall to follow a simple temperature rule. Total precipitation combines different processes. In the simulations, convective and large-scale precipitation behaved in more complicated ways than the total did; as warming progressed, one component’s changes could partly offset the other’s. Total global precipitation still rose in a comparatively regular way, even while its ingredients shifted. The math’s advantage is that it can test the relationship in time without assuming that every component responds instantly or identically.
The framework also uncovered an asymmetry involving the Atlantic Meridional Overturning Circulation, a large-scale system of ocean currents. In these simulations, averaging over periods of more than about 10 years let surface temperature help reconstruct the circulation’s response. But the circulation did not work as a reliable predictor of surface temperature, even with very long averaging. The researchers’ inferred response link suggested that the circulation would weaken over the first 100 years, then the link would change sign and fade over roughly 300–400 years, consistent with weakening over the first few centuries followed by recovery on millennial time scales in the model.
This is the crossover at the heart of the work: a mathematical idea for tracking how physical systems remember a disturbance becomes a way to test which climate variables can meaningfully stand in for others. It also replaces a tempting shortcut—“these two things move together”—with a stricter test. Does the relationship work when one variable’s response is reconstructed from the other’s past? Does it work at the time scale scientists care about? And does it work in the direction being proposed?
The word “causal” needs care here. In this framework, a causal response link means the reconstruction can be made from information available up to the present, rather than requiring values from the future. It does not prove that one measured variable physically causes the other. Both may be reacting to carbon dioxide, while hidden climate processes and feedbacks connect them. The paper’s tests establish conditions for a useful predictor relationship in the model, not a complete map of cause and effect in Earth’s climate.
Nor is this yet a ready-made forecasting tool. The analysis rests on a linear-response assumption and on one climate model’s simulations. Its value is more fundamental: it gives researchers a way to check whether a proposed climate clue has the right kind of memory to be useful. Sometimes the strongest signal is not a snapshot but a history—and the mathematics can reveal when that history carries information, and when it merely looks persuasive.