Two devices can be built to the same design and still answer electricity differently. In a memristor, that difference is more than a manufacturing nuisance: the device’s resistance can change with its electrical history, making it a possible building block for memory and computing. The puzzle is what gives each tiny device its particular behavior. A new study follows the clues from a current–voltage curve down to atomic-scale defects—and back out across the wafer where the device was made.
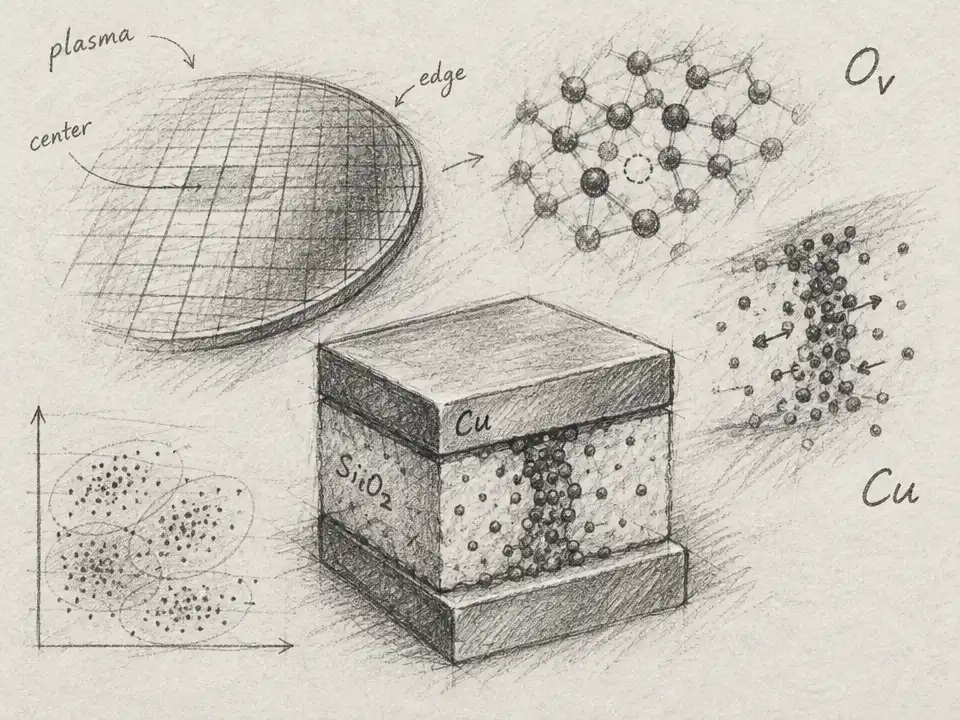
The devices in the study are stacks of titanium nitride, silicon oxide, a thin copper layer, more silicon oxide, and titanium nitride. Inside that apparently simple sandwich, oxygen vacancies—missing oxygen atoms in the oxide—and copper atoms can affect how charge moves. But the exact arrangement of those features is hidden. A voltage sweep reveals only the device’s electrical response, not a direct picture of its internal landscape.
To make that response speak, the researchers assembled measurements from more than 50,000 devices fabricated across 50 four-inch wafers. The data accumulated over three years of process optimization. Each device’s current–voltage curve became a clue to its behavior. A mapping technique grouped curves by their shape, first into 1,156 clusters and then into seven broader switching regimes.
The map did not break neatly into seven sealed-off boxes. Most regimes sat within a continuous landscape, with transition zones where devices showed mixed behaviors. The takeaway: a device’s electrical identity is not always a fixed category. Similar devices can land in neighboring states, and small differences inside the oxide may shift the balance.
Next, the team zoomed out—from the device to the wafer. During sputter deposition, a plasma helps build the silicon-oxide layers. The researchers’ plasma simulations suggest that the conditions vary across the wafer’s surface. Near the center, the modeled oxygen-to-silicon ratio stays around 1.7; toward the edge, it falls to about 1.25. The study’s analysis identifies wafer position as the strongest systematic influence on the reconstructed defect landscape.
That gradient matters because the oxide is not just a passive separator. The simulations suggest that as its composition changes, the network of silicon and oxygen atoms responds differently to incoming particles. Near a ratio of 1.7, the modeled material shifts between two response regimes: a silica-like network that tends to densify, and a more silicon-rich network in which the structure reorganizes and defects become more accessible. Those changes can influence where vacancies form and how copper redistributes.
The electrical data show that the edge is not simply a worse version of the center. It can favor different kinds of behavior. Under one tested deposition condition, at 125 watts, the inferred vacancy increase begins around 20 millimeters from the wafer center and grows strongly toward the edge. At 200 watts, a comparable increase begins farther out, around 35 millimeters, and is less pronounced. The authors associate the stronger edge increase at 125 watts with more resistive behavior; at 200 watts, some edge regions favor memristive switching. Changing deposition time also shifts the mix, but its effects depend on the power setting.
To connect those wafer-scale patterns to electrical behavior, the researchers worked backward from measured curves using device simulations. Those models point to a relationship between oxygen vacancies and copper redistribution. The vacancy level serves as a compact descriptor of the hidden material state—but it is not a direct count of missing oxygen atoms. The authors emphasize that it also stands in for structural disorder and the oxide network’s ability to rearrange. In other words, it is a useful coordinate in a model, not a microscopic photograph.
That distinction matters. The study combines real device measurements with simulations of plasma conditions, atomistic impacts, and electrical response; it does not watch every defect form and then switch a device. The plasma model also underestimates the absolute silicon-oxide deposition rate by about an order of magnitude. The authors argue that some relative quantities, including composition gradients, are less sensitive to that mismatch, but the full chain from manufacturing conditions to internal defects and electrical behavior remains a model-supported explanation rather than a directly observed sequence.
Still, the scale-spanning picture changes the manufacturing question. Instead of asking which single defect makes a memristor work, researchers can ask how fabrication shifts the odds of a device entering one electrical regime rather than another. The wafer position, sputtering power, and deposition time help shape those odds; randomness remains, even when nominal settings match.
For large devices, the measured response may average over many tiny regions with different local states. The authors propose that shrinking the active region could reduce that averaging and make behavior more specialized, though their measurements covered devices from 100 to 2,500 square micrometers and do not establish that prediction at smaller scales. The hidden world inside a memristor is therefore not one perfect switch waiting to be discovered. It is a changing terrain of defects and pathways, shaped partly by where the device sat while its wafer was being made—and still only partly mapped.