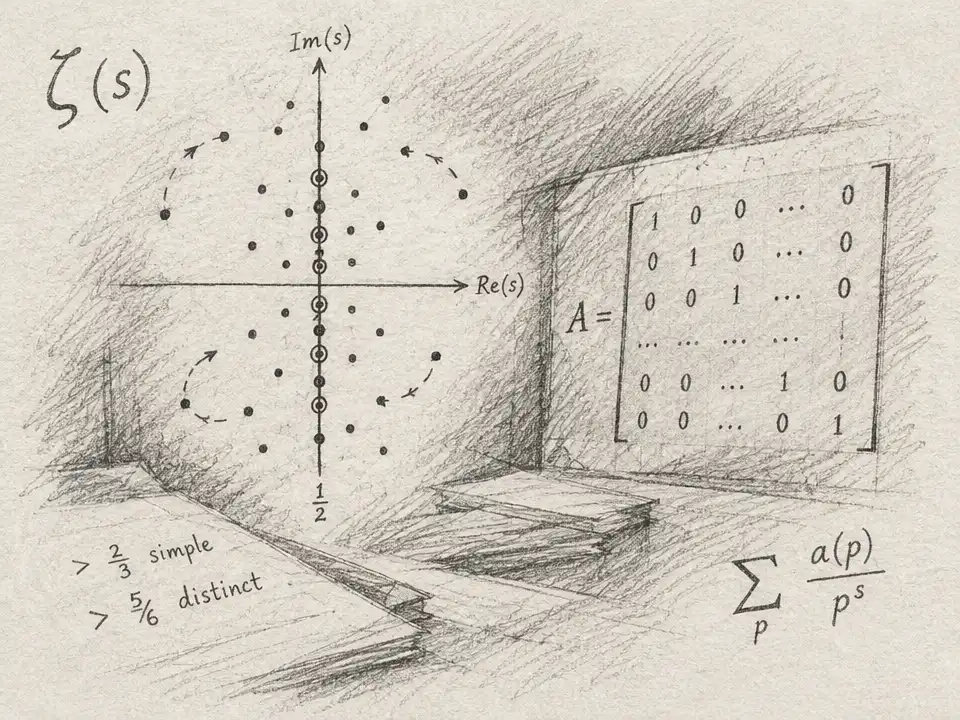
The Riemann zeta function is famous for a question about its zeros. But there is another way to investigate its strange behavior: watch how high its values climb, and ask how often they can do so. Along a particular boundary in the complex plane—the critical line—the function swings between small values and enormous peaks. A new result does not explain every peak. Instead, it gives mathematicians a sharper way to show that certain especially high ones cannot be too common.
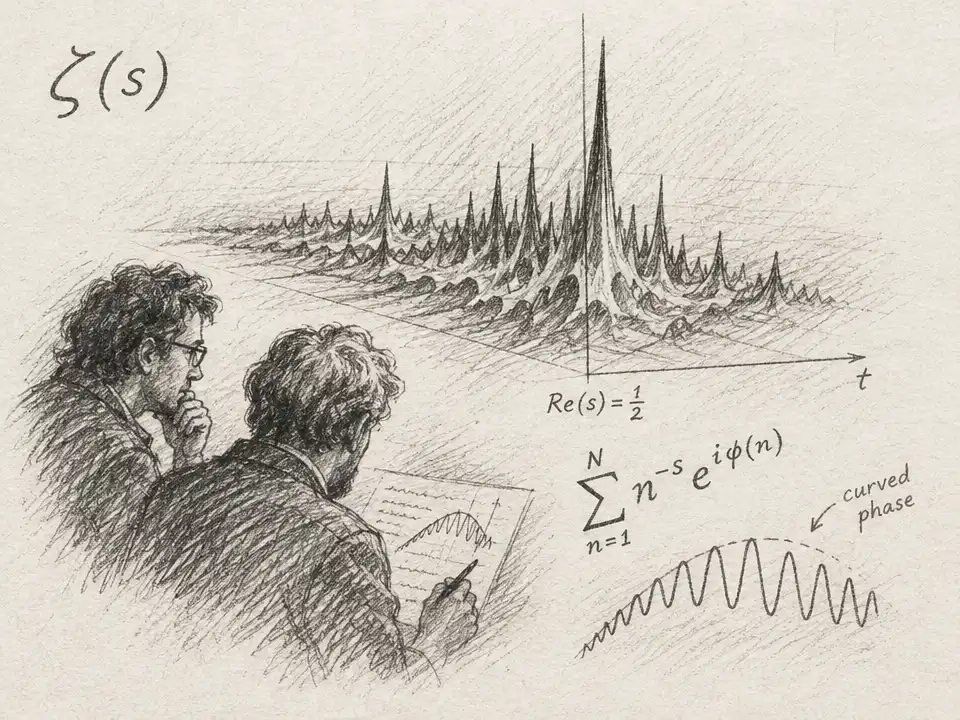
The function begins with a simple recipe: add together powers of the whole numbers, from one upward. That sum works directly in part of the complex plane, and a deeper mathematical extension lets researchers study it elsewhere. On the critical line, the inputs vary along an imaginary direction while the real part stays fixed at one-half. This is where the zeta function’s zeros connect to the distribution of prime numbers—and where its fluctuating size poses some of number theory’s most difficult questions.
One measure of those fluctuations is a moment: take the function’s size, raise it to a chosen power, and accumulate that quantity over a long stretch of the line. A moment is a kind of statistical ledger. It gives exceptional peaks extra weight, so a few very tall spikes can matter more than many ordinary values. The sixth moment is particularly revealing because it sits between two better-understood cases. Before this work, the strongest general upper bound grew like the length of the stretch raised to five-fourths, with a small adjustable allowance in the exponent.
Alexandre de Faveri and Mayank Pandey improve that exponent by one-sixtieth. Their bound grows like the length raised to five-fourths minus one-sixtieth, again allowing an arbitrarily small extra amount. That is a modest change, not a dramatic collapse in the bound. But it is the first improvement on this sixth-moment estimate since researchers derived the older bound by combining results for the fourth and twelfth moments. The new estimate also slightly sharpens upper bounds for every moment between the fourth and twelfth.
How do you count peaks in a function whose value is built from a vast arithmetic structure? The key is to change the object being counted. The researchers first look at places where the zeta function is large—around the level of time raised to one-eighth—and ask how many well-separated locations can reach that height. They prove a sharper limit on that count across a narrow range of heights, from time to the seven-sixtieths power to time to the five-thirty-eighths power. The paper describes this as the first improvement, since Hardy and Littlewood’s work in 1923, on an upper bound at the one-eighth threshold.
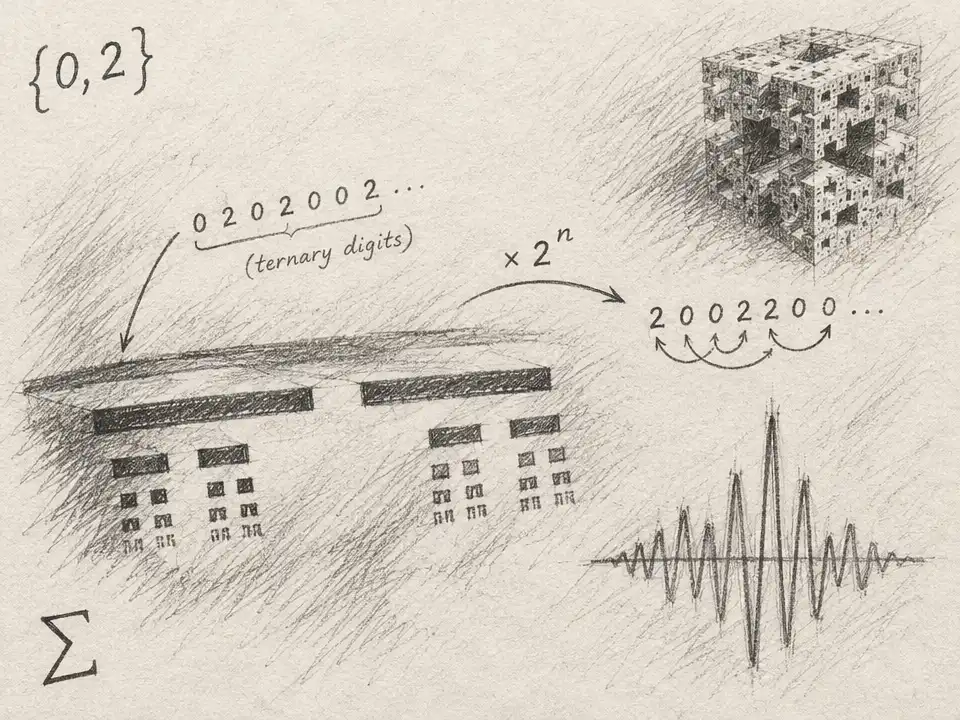
The route from a peak to a count runs through a local average. A tall value at one point is hard to analyze in isolation, but it leaves a trace in the function’s behavior nearby. A classical formula for averages over short intervals translates that local behavior into a sum of oscillating contributions. Each contribution carries an arithmetic weight related to how many divisors an integer has. Its phase—the part that determines how its oscillations line up—has a characteristic square-root shape, with a smaller correction that bends it further.
Those bends matter. A generic oscillating sum can be hard to control: many terms may line up at once, producing a large result. The paper develops a bound for sums with this special curved phase and asks how often they can remain unusually large as the phase parameter shifts. The proof tracks near-collisions among collections of sample points—roughly, cases where different combinations nearly balance. Such collisions can support alignment; the curvature of the phase restricts how often the alignments can recur. This converts a problem about rare zeta peaks into a more structured problem about waves and the arithmetic patterns behind them.
That is the new counting trick’s potential: it adds a tool for bounding large values, rather than requiring researchers to estimate every value one by one. Once the number of high points is controlled at several heights, those counts can be assembled into an improved bound on a moment. The same broad strategy also yields a small improvement for the twelfth moment: its upper-bound exponent drops by five hundred twenty over four hundred forty-five thousand one hundred twenty-one, a saving just over one-thousandth. The authors do not claim to have optimized that saving.
The price is visible in the size and scope of the gains. The sixth-moment improvement is only one-sixtieth in the exponent, and the new large-value estimate applies in a limited height range. An upper bound is also not a measurement of the function’s typical size: it says the accumulated sixth powers cannot exceed a certain scale, not that they reach it. And this result does not prove the Riemann hypothesis or settle the zeta function’s fluctuations.
What it does offer is a new foothold on the rare extremes that make moment problems difficult. The famous conjecture that the zeta function grows very slowly on the critical line remains far beyond this result; improved moment bounds are progress toward understanding it, not a solution. The next frontier is to see whether this phase-sensitive way of counting can be sharpened or carried into other ranges. The promise is a clearer map of the zeta function’s spikes. The obstacle is that each step still depends on controlling the delicate alignments that create them.