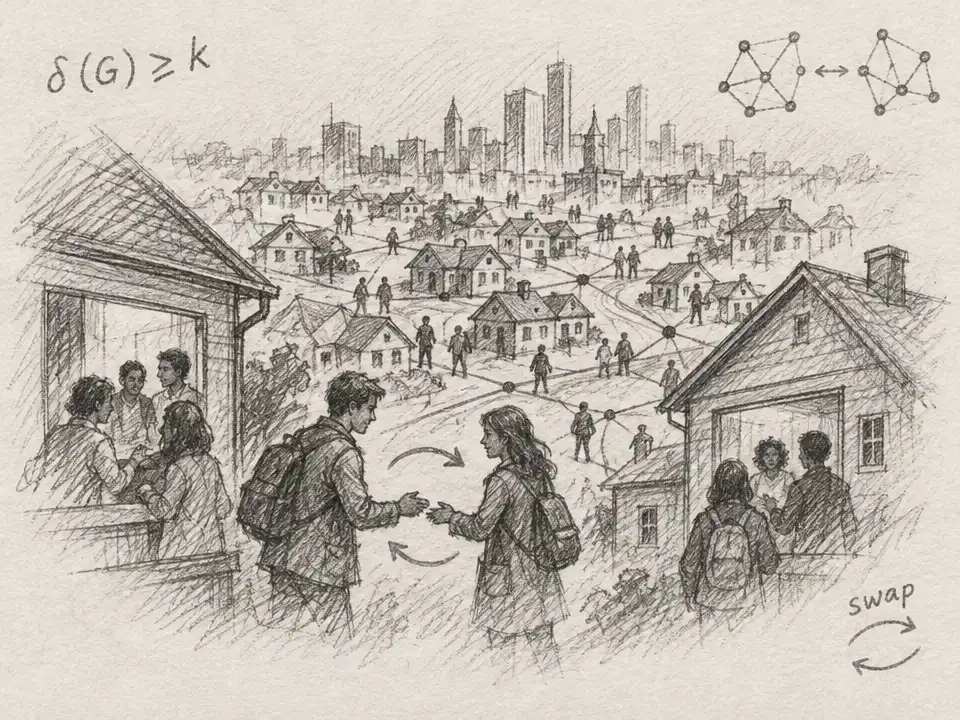
Picture a city on the eve of a lockdown—not as a blur of moving dots, but as a million small decisions about where to spend the next hour. Does someone stay home, travel to work, take a bus, or stop at a shop? A policy changes those choices unevenly. To explore what a different lockdown schedule might do, researchers built an AI model that tries to reconstruct those daily choices before simulating what might follow.
That is a different starting point from simply turning down a city’s mobility. Two days can have similar amounts of travel but very different patterns: one might include crowded transit and busy shops; another, fewer trips but more time in workplaces. Those patterns matter to both exposure and the activity a city retains. And if the policy calendar changes, the historical travel record can’t show what people would have done instead. The behavior itself has to be simulated.
The researchers trained their system on travel data from 911 people in Singapore, observed from 1 March through 31 August 2020. That period covered 184 days and produced 167,624 individual-day records. The model turned each day into a time budget: how much time a person spent traveling, how non-travel time was divided among 12 types of places, and how travel time was divided among transport modes.
This structure gives the AI a more detailed job than predicting whether movement goes up or down. It first estimates how much of a day is spent traveling. Then it allocates the remaining time among places, and the travel time among modes. In effect, the model draws a daily itinerary for each person—one that can shift as the policy phase changes.
People do not all follow the same itinerary. Some routines are more travel-heavy; some are centered on home; some depend on particular transport modes. To represent that variety, the researchers used a mixture-of-experts model: several specialized pathways contribute to a prediction, while a learned gate routes each person-day to a small subset. It is a little like asking different teams to handle different patterns of daily life, rather than forcing every person through one average routine.
But a further obstacle appears when the researchers move a lockdown earlier or later. Recent behavior is a powerful clue to what happens next. It can also become a trap: if a simulated lockdown begins earlier than it did in real life, yesterday’s behavior may still reflect the old policy phase. The model could keep following yesterday’s routine even when the hypothetical rules have changed.
The new approach tackles that transition problem in two ways. First, it teaches the model to treat policy phase as an active signal, and to reduce the influence of recent behavior when that history conflicts with the current phase. Second, it adds a preference-alignment step. A scorer learns to rank observed or phase-consistent behavior above random or wrong-phase alternatives, with extra attention near policy transitions. The model is then adjusted to favor those higher-ranked patterns while staying close to its original behavior predictions.
Here, “preference” does not mean that people or policymakers voted on the best simulated itinerary. The researchers constructed the comparisons from the observed behavior and policy-phase labels. The point is to give the model a clearer training signal about what counts as a coherent response when the calendar shifts.
The team tested the approach first on days held out from training. For place-category predictions, the mixture-of-experts model reduced mean absolute error from 0.101 hours per day in the baseline to 0.049 hours per day. For travel-mode predictions, the preference-aligned version had the lowest reported error: 0.009 hours per day, compared with 0.022 hours per day for the baseline. The models did not win every measure; for example, the mixture-of-experts version was strongest on place-category reconstruction, while preference alignment improved travel-mode errors. That distinction matters: a more realistic simulated city is not captured by one score.
Next, the researchers changed the lockdown calendar four ways: start it seven days earlier, start it seven days later, shorten it by 14 days, or lengthen it by 14 days. The model generated new daily behavior under each scenario, then passed those patterns into a simplified epidemic simulator and an index of urban activity weighted by broad economic sectors.
On the model’s 911-agent scale, the early-lockdown scenario lowered the simulated peak infectious count from 83 under the original policy to 59. The late-lockdown scenario raised it to 91. A short lockdown retained the most activity in the researchers’ index—1.06% above the original-policy result—but also produced a modest increase in simulated epidemic burden. These are not forecasts for a whole country. They are outputs of a calibrated scenario model, showing how its assumptions connect policy timing, individual behavior, exposure, and activity.
That boundary is essential. The researchers note that alternative-calendar behavior cannot be checked against an observed version of events that never happened. Their epidemic model is calibrated to trends using a 911-person sample, not to raw national case counts, and it omits factors including vaccination, variant changes, and household transmission. The activity index also does not measure things like household welfare, employment, or firm revenue.
The study’s central advance is therefore not a verdict on which lockdown a city should choose. It is a way to put a missing step into the simulation: before asking what a policy does to an epidemic, first model how it could rearrange the hours people spend at home, at destinations, and in transit. That makes the “what if?” more like a city with daily routines—and less like a single mobility dial.